
3 Versions of Performance Dashboards for 21st Century Companies
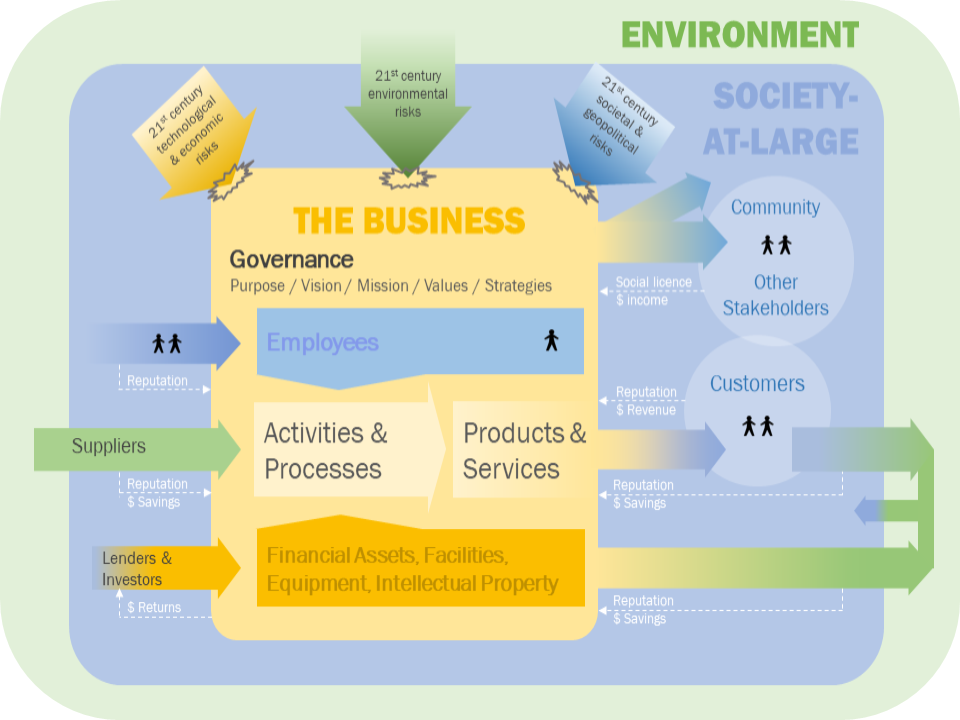
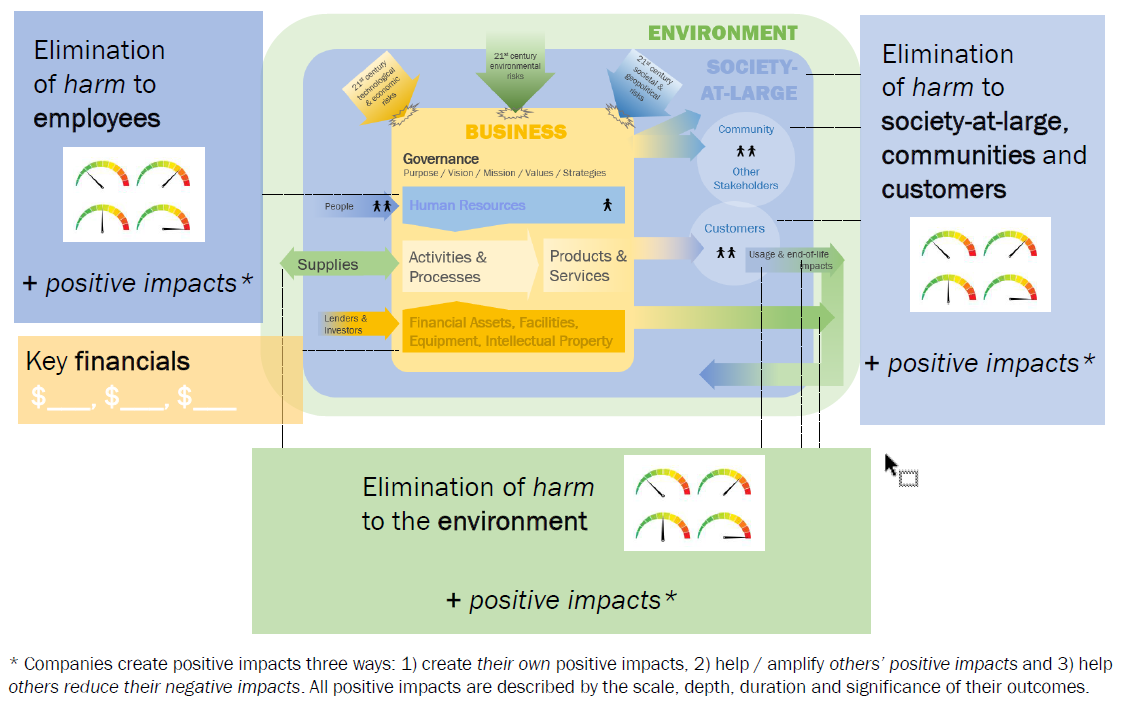
Suppose a company decides to use a 21st century business model, as shown above and described in my last blog. Then, suppose someone asks, “How’s it going?” To answer the question comprehensively, wouldn’t it be nice to invite the questioner into a control room where the business model is the centerpiece, surrounded by company performance indicators? The company’s direct and indirect impacts on key stakeholders ‒ employees, the environment, society-at-large, communities and customers ‒ would be quantified and connected to where and how those impacts occur in the company’s business model. The resulting dashboard would provide a decision-ready overview of company financial and non-financial performance.
To illustrate this suggestion, a generic version of the dashboard template is shown above. Now, let’s take a look at how the dashboard might look if non-financial performance were assessed using three different sustainability frameworks: the Future-Fit Business Benchmark (FFBB), the Sustainable Development Goals (SDGs) and Integrated Reporting <IR> Capitals.
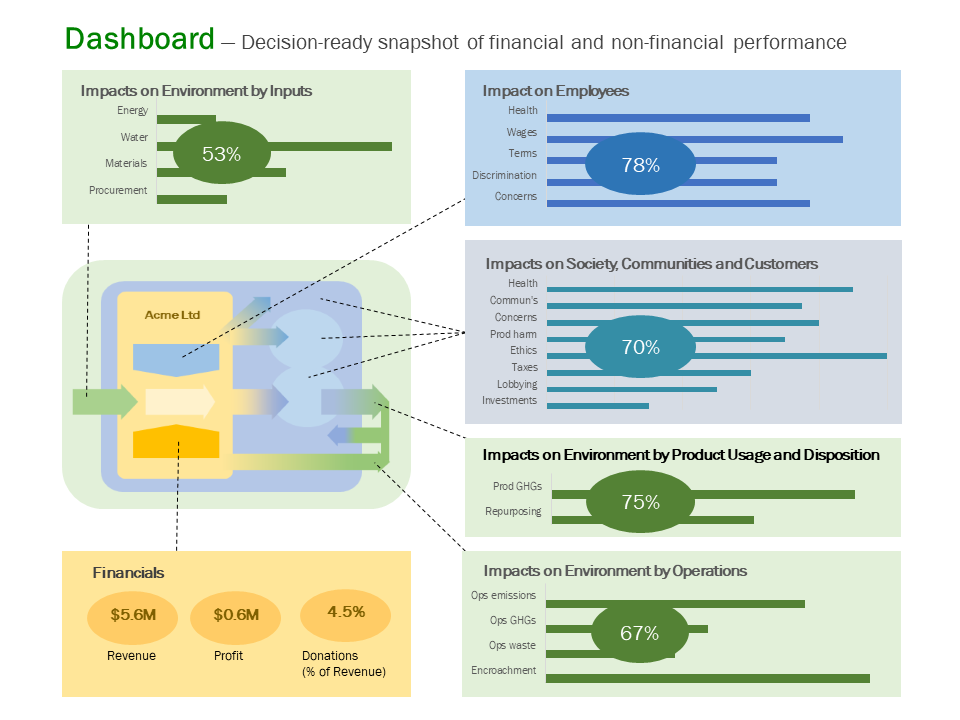
Future-Fit Business Benchmark version of the dashboard
The Future-Fit Business Benchmark (FFBB) Assessment Toolkit assesses company performance on comprehensive, science-based, business-relevant sustainability goals. Performance on necessary FFBB Cause-No-Harm / Break-Even goals is expressed as percentage scores on progress toward eliminating negative impacts on key stakeholders. Performance on optional FFBB Do-Some-Good / Positive Pursuits is used to describe how the company positively contributed to the wellbeing of those stakeholders during the reporting period. A brief description of any positive pursuit’s scale, depth, duration and significance could be noted on the dashboard and described in greater detail elsewhere. Here is an example of how the resulting dashboard might look, using various percentages for illustrative purposes.
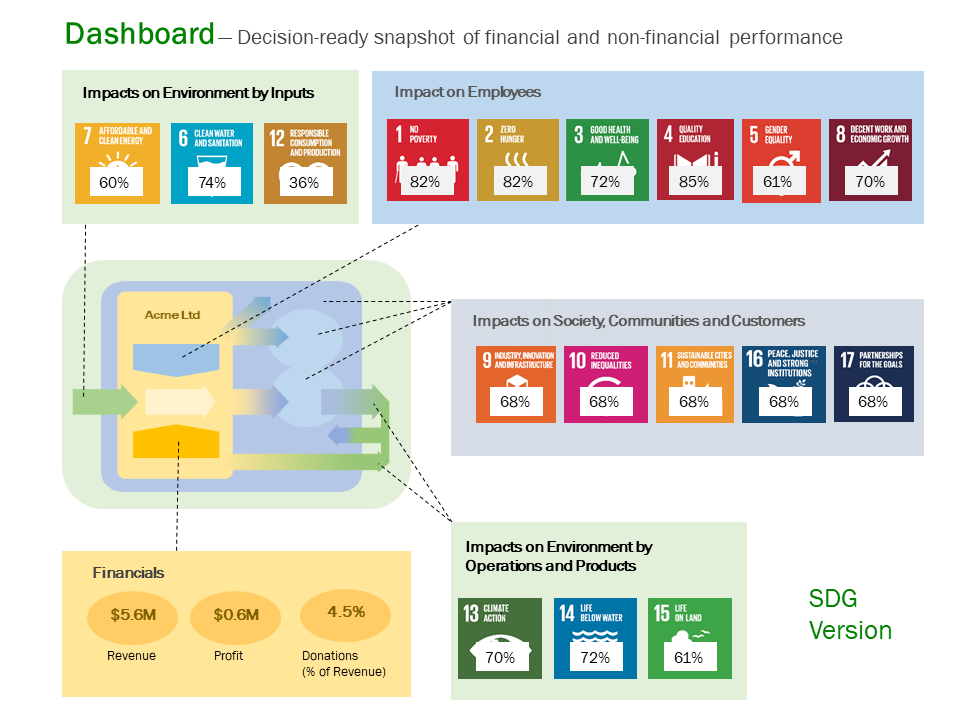
Sustainable Development Goals (SDGs) version of the dashboard
The SDG Assessment Toolkit assesses company positive and negative contributions to the SDGs. Performance on the FFBB Cause-No-Harm / Break-Even goals associated with each SDG is used as a proxy for company progress on eliminating negative contributions to that SDG. Performance on the FFBB Do-Some-Good / Positive Pursuits associated with each SDG is used as a proxy for how much the company positively contributed to that SDG during the reporting period. A brief description of any positive contribution’s scale, depth, duration and significance could be noted on the dashboard and described in greater detail elsewhere. Here is an example of how the resulting dashboard might look, using various percentages for illustrative purposes.
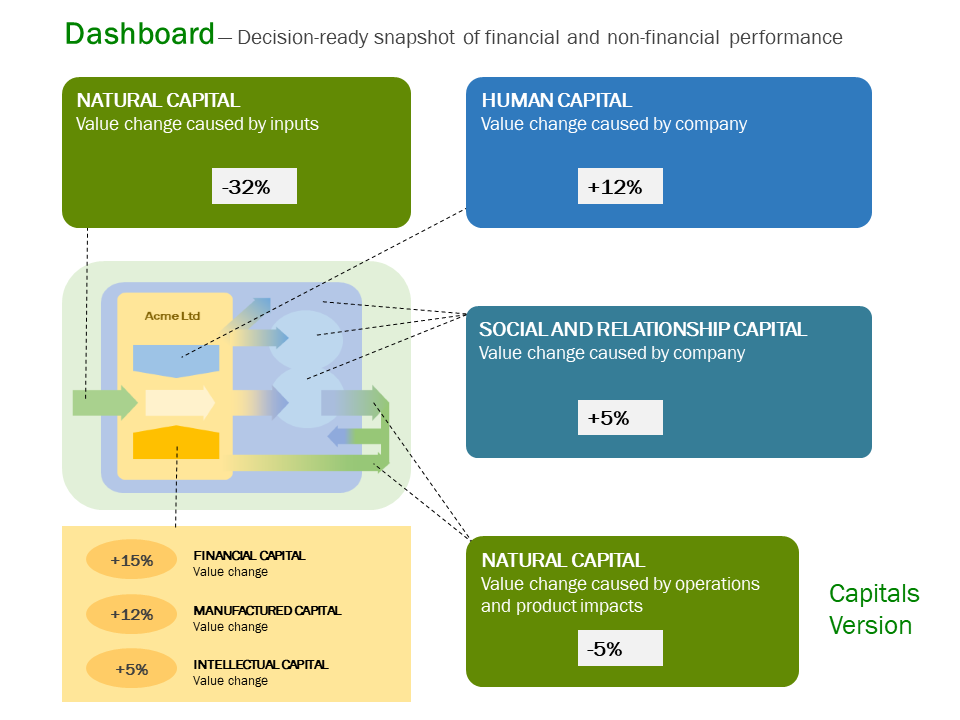
Integrated Reporting <IR> Capitals version of the dashboard
The IR Capitals Assessment Toolkit assesses company impacts on natural, social and human capitals. Performance on the FFBB Cause-No-Harm / Break-Even goals associated with each capital is used as a proxy for the company score on eliminating negative impacts on that capital. Performance on the FFBB Do-Some-Good / Positive Pursuits associated with each capital is used as a proxy for how much the company increased the value of that capital over the reporting period. A brief text description of any capital-creating initiatives would be appended to the appropriate section of the figure and described in greater detail elsewhere. Here is an example of how the resulting dashboard might look, using various percentages for illustrative purposes.
Companies can use the environmental, social and governance (ESG) / sustainability framework of choice. The referenced free, open-source business model and dashboard templates are intended to be tailored to a particular company’s situation and to stimulate creative design ideas. For example, the dashboards can be jazzed up with clever graphics, dials, bar charts, fonts and colors to help management quickly identify and prioritize areas that warrant attention. Online versions allow stakeholders to drill down in areas of interest, solving the usual dilemma of whether the dashboard should be designed for investors or for other stakeholders ‒ it serves both sets of needs.
The dashboard can be featured in sustainability / ESG reports and disclosures as context for focus on any particular theme, such as company efforts on climate change. It helps connect the dots between financial and non-financial performance. It’s a fit-for-purpose diagnostic tool for a 21st century company with a purpose and mission to improve the wellbeing of its key stakeholders.
What’s not to like …?


